REI-UN: A case study of tactical asset allocation
Introduction
I first came by the concept of tactical asset allocation while studying for the QFIPM Exam. Looking back, I may have succesfully done it in practice. The experience is recorded in this post, mostly for my own reference in the future. It may also be a casual reading for those interested in stock investment.
Before proceeding, let me state clearly the usual disclaimers: This is not investment advice. I am not an investment professional. Past performance is not indicative of the future. Blah blah blah...
Strategic vs Tactical Asset Allocation
Investors typically have a long-term expectation of the stock market, which, combined with their long-term investment goals (time horizon, return objectives, risk tolerance, etc.), would lead to a strategic asset allocation. For example, for a young passive investor with a relatively long investment horizon (say, 30 years), a reasonable strategic asset allocation is to put all their money into SPY/ QQQ (or e.g. ZSP.TO/ZQQ.TO, if they are in Canada).
In contrast, tactical asset allocation takes advantage of short-term market opportunities. For example, a company or a sector may be temporarily undervalued due to certain events (say, when COVID-19 hit, the airline stocks suffered a lot due to travel restrictions). If an investor believes the stock price will eventually recover to its fair value, they may opt to overweight the undervalued company or sector, even if such asset allocation deviates from their long-term investment objectives (corresponding to stratigic asset allocation). When the stock does eventually recover, the overall rate of return is enhanced compared with using the strategic asset allocation alone.
Of course, there is risk associated with tactical asset allocation. Whether or not a stock is undervalued is subjective, so the investor could well make a wrong judgement, leading to a loss. Also, the stock may eventually recover but it takes a longer time frame than can be accepted by the investor, resulting in high oppotunity costs.
Note that short-term market opportunities may also arise from overvalued stocks, of which the strategy is to take a short position (or buying a put option, constructing a bear option spread, etc.). However, retail investors are less inclined to apply such strategies due to inherently higher risks and barriers of implementation.
Opportunities post-COVID Crash
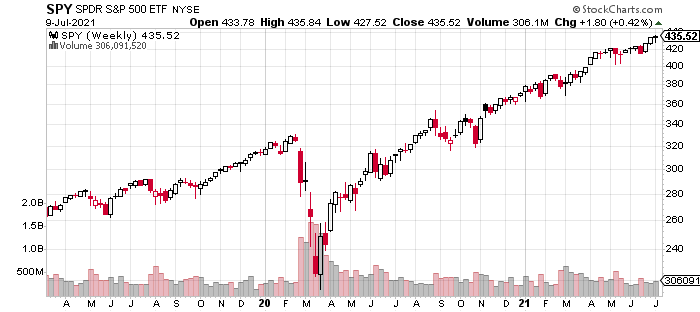
In March 2020, the stock market crashed due to COVID-19, with the S&P500 index sinking as much as 30%. However, it has since recovered and reached a new all-time high in roughly five months (see below). Looking back, whoever wasn't afraid and bought near the bottom would have enjoyed quite some gains.
Notably, certain industries have suffered more significantly due to various COVID-related restrictions, including airlines (e.g. JETS), travel agencies (BKNG), retail (JWN), hotels (MAR) and cruise lines (RCL), to name a few.
In retrospect, these industries are all prime short-term opportunities for a tactical asset allocation. Even back in 2020, when the pandemic seemed out of control, I'd venture to say that the world is eventually going back to normal (since a vaccine/medicine was bound to be available at some point). Consequently, the COVID restrictions would eventually be lifted and all these affected industries and companies would recover, if not surpassing pre-COVID levels. It could be a year, or two years, or even longer, but it is only a matter of time (which would not be too long).
REI-UN: Risk vs Reward
However, it is always easier said than done. I myself did not put in any additional money into the stock market during the COVID crash: I just patiently waited it out with my existing positions. Things changed in August 2020 when I came across an Internet post about how RioCan (RIO-UN.TO), a Canadian REIT (Real Estate Investment Trust), was undervalued due to COVID-19.
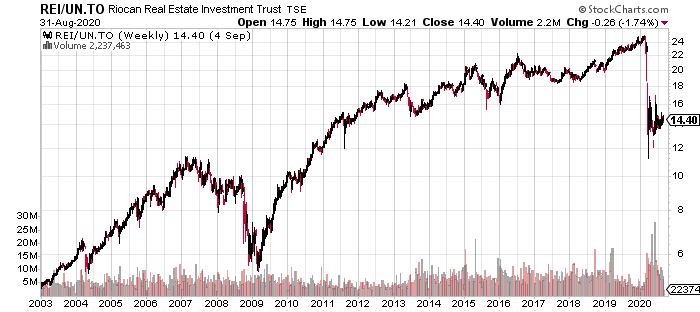
The post seemed to make a fair point, so I started doing my own due diligence. The first step was to look at its historical price chart (see below). The company had a major crash around year 2008-09. This is mostly attributable to the global financial crisis, but the fact that RioCan is in the real estate sector has also played a significant role. Afterwards, the company recovered and the price has been quite steady until the COVID crash, during which the stock price decreased by as much as 50%.
Next, I looked at the company's profile. According to Yahoo Finance (here) and the company's website (here), RioCan is Canada's largest REIT (translation: it is highly unlikely to go out of business). It has a mixed porfolio of commercial, residential and retail properties (translation: it leases its properties for people to work, live and shop in. The portfolio is quite diversified, which is a good thing), with a focus on retail real estates. Some of their largest clients include Loblaws, Canadian Tire, Metro and Shoppers (again, these companies are not going backrupt anytime soon, so they will be able to pay rent on time to RioCan).
The company profile seemed quite good from a fundamental point of view. In short, it is a health company which is unlikely to go out of business in the long run. It is only due to COVID-19 that the company has taken a temporary hit, which, in my opinion, is a combination of market risk (everything is going down due to COVID) and company-specific risk (e.g. some smaller tenants are not able to pay their rent on time). Therefore, I believe that REI-UN.TO is only temporarily in distress, but would soon recover to pre-COVID levels.
Given such personal opinion and forecast, REI-UN.TO presents a short-term opportunity for tactical asset allocation.
Another interesting characteristic of REI-UN.TO is that, as required by regulation, the stock pays out monthly cash distributions (which is essentially a dividend, but so named specifically for REIT's). As of August 2020, RioCan has been paying $0.12 per month, or $1.44 annually. This corresponds to roughly 10% of dividend yield, which is quite attractive (although one should not invest in a stock solely for its high dividends).
Instead of receiving cash distributions each month and leaving them be, I would opt to use those cash payments to further buy shares of REI-UN.TO, which is essentially a dividend reinvestment (as discussed in any introductory finance course), or DRIP (Dividend Reinvestment Plan, as commonly used by stock brokers). As I expect the share price to recover to pre-COVID levels, it would be beneficial to take advantage of lower prices now and in the near future, thus adding to my overall rate of return.
Finally, to further enhance my return, I decided to make this investment in my Tax-Free Savings Account (TFSA). As the name suggests, any dividend or capital gain is not taxable within this account. This is especially beneficial for DRIP, since I can potentially buy more shares with the pre-tax cash distributions.
After some more research on the Internet and thoughts, I made a rough plan for this tactical asset allocation to REI-UN.TO, summarized below.
Time Horizon : 1~2 years, which is how long I expected the stock to recover from COVID-19.
Expected Return: Entering at around $14.00, I would expect to exit my position at around $26.00~27.00, roughly the pre-COVID level. Combined with cash distributions and reinvestments along the way, the expected return seems very attractive.
Potential Risks:
The stock takes longer to recover. However, I am comfortable with waiting a bit longer.
The stock never recovers to pre-COVID levels but stays relative stable around current price levels. In this scenario, I still benefit from cash distributions along the way. This could result in breaking even or only a small gain (but I am incurring opportunity costs by not putting the money to better use).
The stock continues to plunge and never recovers. Consequently, I may incur a loss and also permanently lose some room for my TFSA account.
Having carefully evaluated the risks and rewards of this plan, I decided to go ahead and put it into action.
Cashflow and Return Analysis
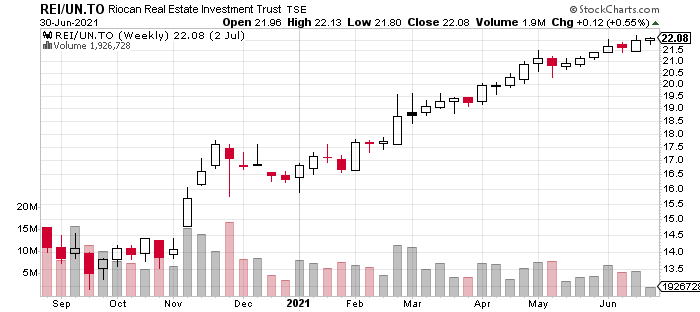
The chart below shows the price history of REI-UN.TO from September 1, 2020 to June 30, 2021. Indeed, as I expected, the share price steadily recovered from $14.00 to $22.00, and the upward trend does not seem to have stopped yet. A very noticeable jump occurred in November, which coincided with the release of positive vaccine news (see e.g. here).
Clearly, I have made quite some gains from this short-term strategy, but how much? The following table shows the changes in my REI-UN.TO position.
| Date | Shares | Price | Total Cashflow |
|---|---|---|---|
| 9/10/2020 | 1111 | 14.75 | 16387.25 |
| 10/7/2020 | 9 | 14.37 | 129.33 |
| 11/6/2020 | 9 | 14.68 | 132.12 |
| 12/7/2020 | 7 | 17.49 | 122.43 |
| 1/7/2021 | 7 | 17.27 | 120.89 |
| 1/18/2021 | 344 | 17.54 | 6033.76 |
| 2/5/2021 | 6 | 17.97 | 107.82 |
| 2/26/2021 | -15 | 18.07 | -271.05 |
| 3/5/2021 | -478 | 19.11 | -9134.58 |
| 3/8/2021 | 6 | 19.10 | 114.60 |
| 4/9/2021 | 4 | 20.10 | 80.40 |
| 5/10/2021 | 3 | 21.35 | 64.05 |
| 6/8/2021 | 3 | 21.70 | 65.10 |
My trading activities are listed below.
On September 10, 2020, I entered an initial position of 1,111 shares at $14.75 per share.
In the following months, I have received regular cash distributions, which were automatically used to purchase small numbers of shares in the first week of each month.
On January 18, 2021, seeing the stock was recovering from COVID, I bought more 344 shares using the TFSA contribution available for year 2021 (see here).
On February 26, 2021, I sold a small number of shares for cash (to cover fees needed to transfer my investment account).
On March 5, 2021, I had 1,478 shares of REI-UN.TO in total. I sold 478 shares (or 32%) of my position at $19.11 per share, in pursuit of another opportunity. At that time, the momentum of increase seemed to slow down for a bit (see the small red bar above), so I also wanted to lock in at least some gains.
As of June 30, 2021, I have 1,016 shares valued at $22.08, or $22,433.28 in total.
Let's set September 10, 2020 as time 0, and assume 365 days per year. Suppose I clear my REI-UN.TO shares on June 30, 2021, then the cashflows of my REI-UN.TO positions are summarized below.
| t | CF |
|---|---|
| 0 | 16387.25 |
| 0.3561 | 6033.76 |
| 0.4630 | -271.05 |
| 0.4822 | -9134.58 |
| 0.8027 | -22433.28 |
Note that I am only counting my own contribution/withdrawal. That is, the monthly cash distributions and reinvestments should be ignored when constructing this table (as they are part of the investment return). Also, the residual monthly cash distributions are ignored (e.g. if $111 is distributed for a month, and 5 shares are purchased at $22.00, then the remaining $1 is simply discarded).
Recall from financial mathematics, the dollar-weighted rate of return satisfies the equation
which yields , or 73.41% annually.
Alternatively, we can calculate the internal rate of return (IRR) defined by the equation
which yields , or 77.26% annually.
For comparison, the dollar-weighted return and IRR of SPY over the same period are 37.54% and 38.82%, respectively. In other words, my short-term tactical asset allocation in REI-UN.TO has been very successful over the 9-month period of COVID recovery!
Looking Forward
With roughly 1,000 shares still in hand and continuing with DRIP, my plan is to sell half of my position at the original target price of $26.00~27.00. Depending on the outlook, I may sell the remaining portion at some date, but ideally no later than the end of 2022. By then, the stock will probably have fully recovered, meaning its price appreciation would be quite limited (as indicated by the price history during 2013-17). Despite monthly cash distributions from REI-UN.TO, I will probably have already found better use of capital by then, and will most likely move on to another stock.
Concluding Remarks
So, what have I learned from this experience? Quite a lot! I write out my key takeaways below.
Textbook knowledge can be very useful in practice (in this case, tactical allocation and dividend reinvestment). When I first bought REI-UN.TO, I didn't realize that I was putting what I learned into action. It is only months afterwards that I made the connection. Hence, it is beneficial to periodically reflect on what I am doing.
Due diligence is very important when making investment decisions. Admittedly, I was not conducting the best analysis possible, but it was something. Moreover, this entire experience would be quite informative for all my future investment decisions. Afterall, learning by doing is can be quite effective.
Opportunities such as the COVID crash rarely occurs, but when they do, one needs to "be greedy when others are fearful". Moving forward, I would always have some spare cash at hand, in order to better take advantage of such tactical opportunities.
With that said, it is never a bad idea to be slow and steady when investing. It always makes sense to strategically allocate a significant portion of my overall portfolio to safer investments, such as SPY/QQQ as mentioned at the very beginning of this post.
Website built with Franklin.jl and the Julia programming language,
plus some help from LeXtudio.